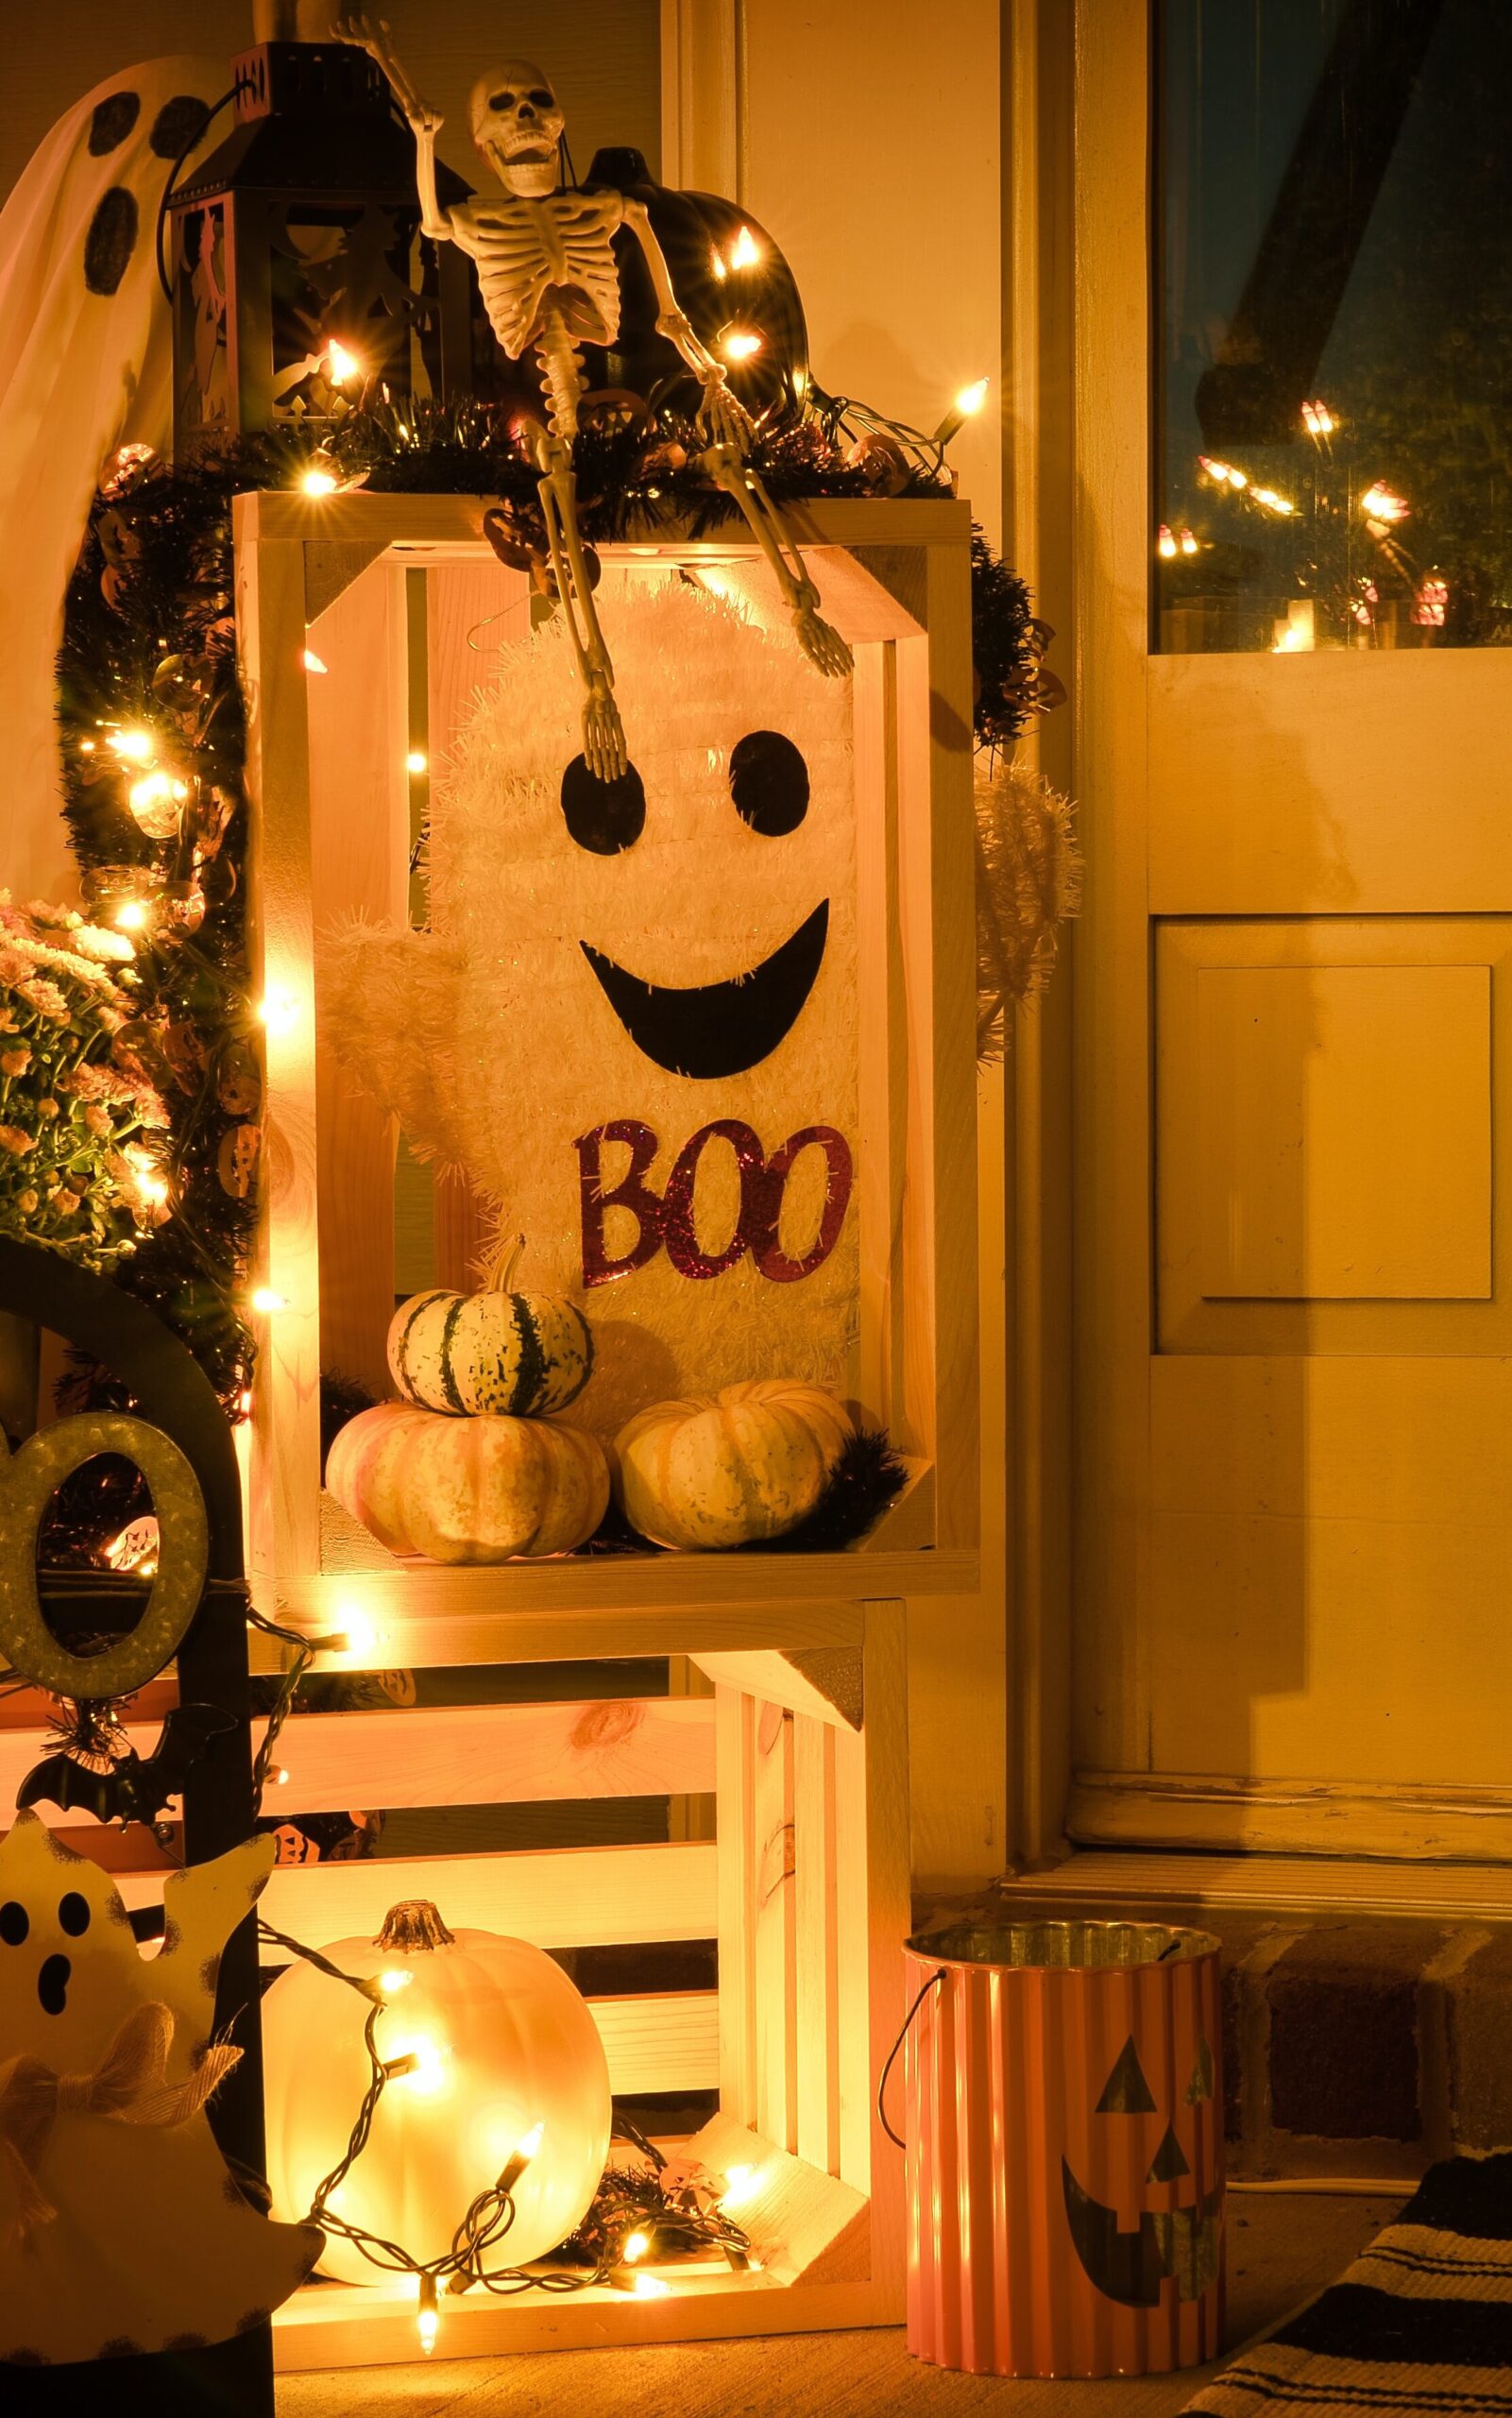
Halloween 2022 🎃

Knock Knock!
Who’s there?
Boo.
Boo who?

 đŸ€·

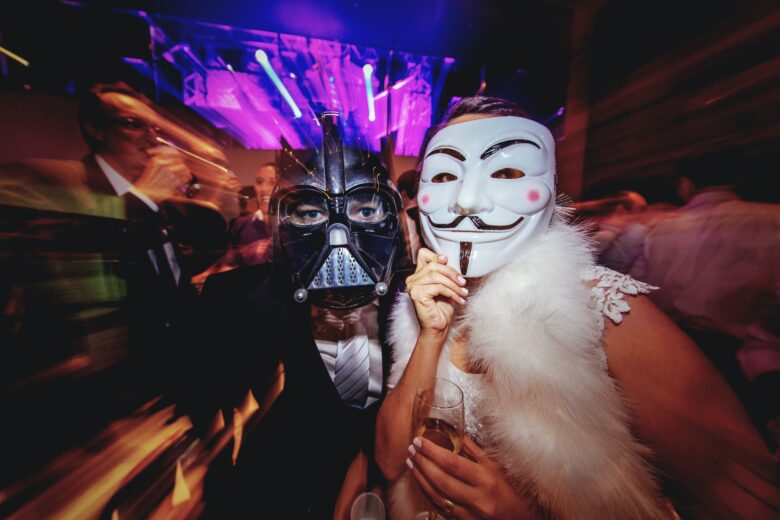
Do you know what you’re dressing up as this Halloween? Will you dress up at all?

Whether you’re planning to pull a Heidi Klum and go all-out with your costume or just simply throw a white sheet over yourself à la E.T., there’s no better time of year to inject a little spook into your style.

However, if you’re stuck for inspiration, don’t worry — we’ve got you. In this report, we look at Halloween trends across the globe to find out what people are wearing in 2022.

Let’s get shrieky!

Methodology.

Klarna’s Halloween survey was sent out online during October 2022 in collaboration with research agency Dynata to a representative sample of more than 17,540 consumers across 17 countries and 3 continents, with more than 1,000 respondents per country.

17,540 consumers

18-65 years old

Dressing up for Halloween.

Getting ready for Halloween is an event in itself. But what to wear? We’ve got the low-down on who’s fully committed to spooky season this year and whose ideas are yet to be brewed.

Who’s bringing the costume love?

America! Almost 1 in 3 Americans already have their Halloween costumes ready to go and that number might still grow.

20%

of the people we surveyed around the world want to dress up this year.

37%

of Americans have their costumes planned. 16% are still undecided. If these maybes ⼕ yeses then over half of the population will be dressed up!

Night of the living dead young!

Gen Z and Millennials are far more likely to dress up than older generations, and there is an equal split between genders.

44%

of Gen Z’ers around the world are planning to dress up


3%


but Baby Boomers aren’t into it.

Step your game up!

Winning the costume competition might be significantly harder than it was a year ago.

+28%

Make space! The size of this year’s global party is set to increase by 28% compared to last year.

Fit goals

Pulling a great Halloween fit together is no easy task. Firstly, you need to identify your goal. Do you want to be scary? Sexy? Or would you rather make someone laugh?

What do you meme?

Halloween delivers the perfect excuse for spending hours swiping through social media and binge-watching TV. After all, it’s research!

TV series & movies

are the most common sources of inspiration (44%), while ghosts, mummies, vampires, and other classic horror characters follow creepily close behind (41%)

Budget vs blow-out.

How much cash are you prepared to splash on your Halloween get-up?

$87

is the average Halloween costume budget.

57%

will spend between $26 and $100.

6%

already have, or will borrow, everything they need.

Pick your fighter.

Sexy, scary, or funny? Which boxes will your look check?

57%

will go for a scary look.

49%

would rather scream with laughter.

20%

will take the opportunity to show some skin.

An American, an Aussie, and a Frenchman walk into a bar…

Ever wondered whether a person’s nationality influences their Halloween aesthetic? Well, now you know


The French

are most likely to come dressed scary (70%) while


Aussies

will likely arrive in something funny (60%) and


Americans

will probably turn up in something sexy (34%).

A fang-tastic night.

A great costume is about more than just clothes.

Serving (scary) face.

Make-up is an integral part of most great Halloween costumes.

2 in 3

will buy specific make-up for Halloween.

Men

are more likely (75%) to buy make-up compared to women (63%). Gender has a bigger impact than age when it comes to putting makeup on the Halloween shopping list.

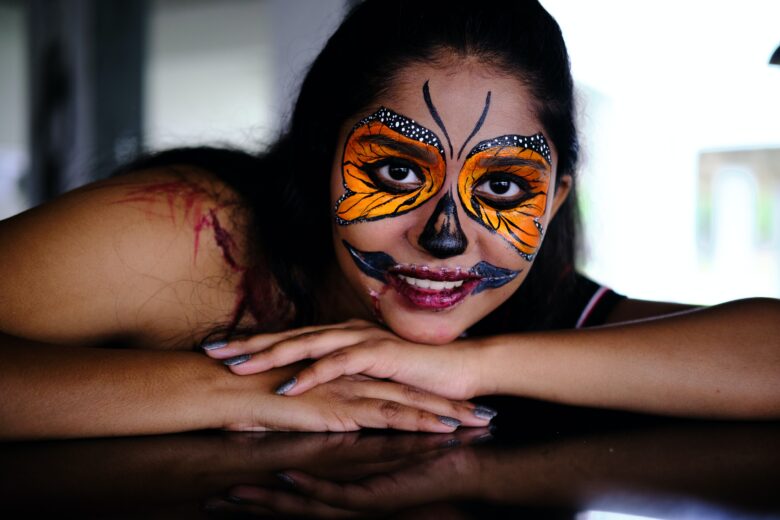
Let the transformation commence!

The best thing about Halloween is that you can become anyone or anything you want. But what is this year’s most popular look?

45%

of Americans will be going for something artistic, far more than in any other country.

Ghosts, goblins, monsters, and other pets.

There’s no better company during a night of spooky festivities than furry family members.

Santa’sSatan’s little helper.

Many pet owners are planning to involve their pets in the festive fun.

28%

of Americans will dress up their pet — that’s double the global average (14%).

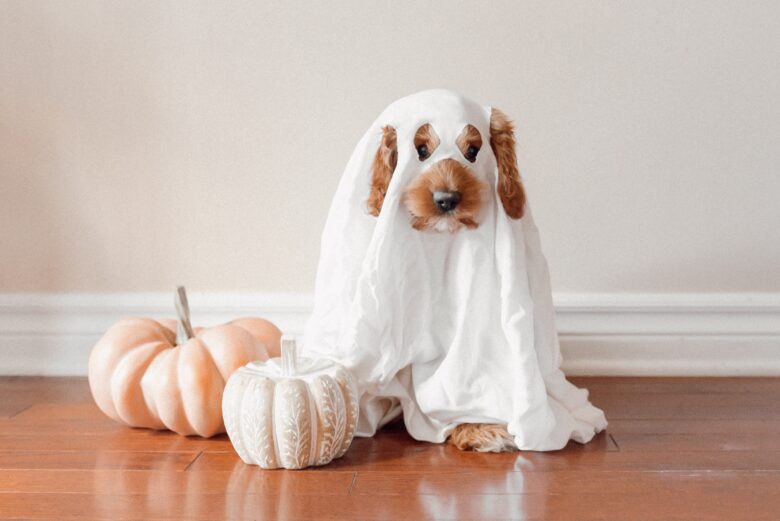
Turning a happy doggo into a scary spider…

…or turning a scary spider into a happy doggo?

Aussies

Aussies are among the most likely to dress up their pet in something scary (70%).

French

Meanwhile, in France people are most likely to dress their pets up as something funny (56%).

Social media memes reign supreme.

They say cats own the internet, so perhaps it’s no wonder that social media trends and memes are the main costume inspiration for pet owners.

41%

take inspiration from social media trends or memes for pet costumes.

Cats vs dogs.

It’s official: Cat owners are more likely to dress up their four-legged friends as something scary, while dog owners will usually take the comic route.

61%

of cat owners will dress up their cats in scary costumes compared to 51% of dog owners.

64%

of those who have both a cat and a dog plan to dress their pets in funny costumes.
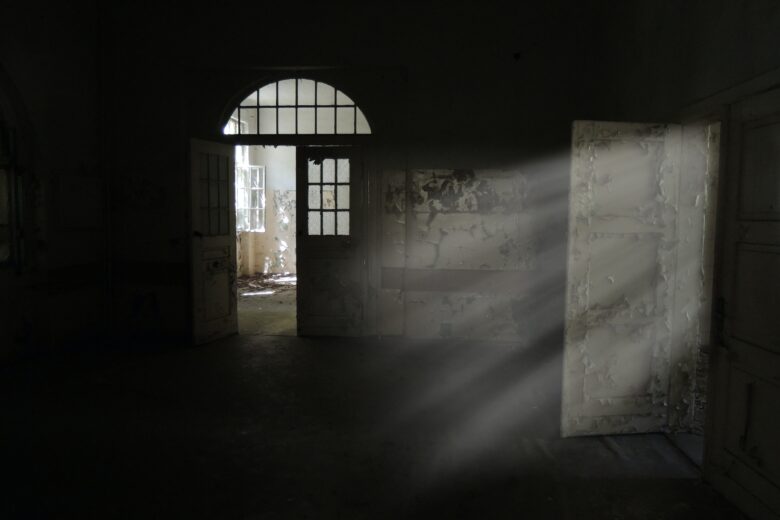
Do you like scary movies? đŸ‘»

Halloween fun doesn’t have to mean dressing up and going out. Staying in to watch scary moves (and hide behind pillows) is also a scream.

Oh, the horror!

For many Americans, there’s nothing better than a scary movie on Halloween.

Out of all countries


Americans watch horror movies the most (63%), while the Dutch watch them the least (26%).

Can’t get enough.

Turns out that most people that watch horror movies on Halloween do so because they genuinely love them. Of course, there are a few brave souls who still watch horror films despite dreading the experience!

The Finnish are seemingly the most chill when it comes to watching horror. 33% say they’re unbothered and that it’s “just another movie genre.”

Americans

are the biggest horror movie fans (72%).

Australians & Belgians

are united in their hatred (16%).

Finns

are the most indifferent (33%).

Portuguese

are the most accommodating, mostly watching them when others want to (13%).

“DON’T GO IN THERE!”

The most popular reasons to watch horror movies are nostalgia and social experience. But for some, it’s about picking up survival tips. At least some of us will be prepared for the zombie apocalypse


44%

say the social experience is the most important reason for watching horror movies, on a global average.

28%

of Australians, Canadians, and the French watch horror to pick up survival tips
 yikes!

The greatest horror movie of all time is


Drumroll, please đŸ„đŸ„đŸ„ After years of debate, we’ve finally settled the Halloween movie debate once and for all. You’re welcome!

Movie fans around the globe agreed that when it comes to horror, the classics come out on top.

Movie fans around the globe agreed that when it comes to horror, the classics come out on top.

1. Halloween (1978)
2. The Exorcist (1973)
3. Friday the 13th (1980)

Which one will you be watching? 🍿

And that’s that.

Thirsty for more knowledge?

Make sure to check out the other reports available at Klarna Insights.

Dreams.

Dreams take many forms. There are the ones when people shut their eyes and nod off to sleep—whether for a brief snooze or a restful evening—and there’s the more aspirational sort. Some dreams see a person take flight and soar high above the earth, and some involve purchasing or acquiring a desired object. 

While Klarna hasn’t yet figured out how to make that dream of you shooting laser beams from your eyes a reality (don’t worry, we’ll get engineers on it!), we are laser-focused on helping shoppers score the dream item they’ve always wanted. 

In celebration of World Dream Day we’ve conducted research including more than 20 000 consumers from across the world to better understand what shoppers dream about (from the literal to the figurative). And based on what we learned we’ve created the Dream Deals Report, exploring shoppers’ dreaming habits and patterns, and their dream purchases and shopping desires.

Methodology.

Klarna research occurred in May 2022, in cooperation with Dynata and across 19 countries (US, Canada, UK, Ireland, Australia, New Zealand, Germany, Austria, Poland, Netherlands, Belgium, France, Sweden, Norway, Finland, Denmark, Italy, Spain, and Portugal). The survey includes a minimum of 1,000 respondents in each country. In total, 20,413 consumers ages 18 to 75 participated.

19 countries

20,413 consumers

Dreams.

First, the literal. With nearly 8 billion people in the world, there is a whole universe of imagination created by our subconscious every day.

This chapter explores people’s actual dreaming habits and patterns, looking at how often people dream, the types of dreams, and the most common themes globally and nationally.

The dreamiest nation is


Quantifying the number of dreams every day is a herculean task, but when asked how frequently a person can recall their sleeping dreams, the global average comes to 119 days in a year. For those moments during the day when people drift off for a bit, the average number of days with daydreams is 107, making the combined number of total dreams for the average person around 226 per year.

While nighttime dreaming is consistent worldwide, there is a much more diverse frequency for daydreaming connected to the region where a person lives.

For example, people in Ireland are most likely to daydream (145 per year), while those in Poland are significantly more unlikely to do so (43 per year). The difference between the Nordic countries of Sweden (132), Finland (128), and Norway (124), though, is much less pronounced, with a difference of only 8 separating them. And while thousands of kilometers divide the nations, there’s no separation between the people of Australia and New Zealand when it comes to daydreaming.

  • Canadians have the most dreams at night (143) on average, while the US has the most daydreams (141) per year.

  • The Irish have the highest number of dreams (272) per year, counting both night and day.

  • Men and women average the same amount of dreams at night per year (119), while women daydream 13% more over a year.

Daydream believers.

The US has the most average daydreams per year (141), while Ireland is the country with the most daydreams compared to night dreams (+19 more daydreams), and Poland and France are on the opposite side (+63 more night dreams).

Day dreamers

US, UK, Ireland, Australia, New Zealand, Sweden, Finland

Night dreamers

Canada, Germany, Austria, Poland, Netherlands, Belgium, France, Norway, Denmark, Italy, Spain, Portugal

The dreams of youth.

The younger you are, the more likely you will have healing dreams or ones where you dream something that later actually happens, while lucid and recurring dreams seem consistent across generations. On a global average, Gen Z’ers are more than twice as likely to have healing (+145%) and prophetic (+123%) dreams than Baby Boomers.

Highest share of

Healing dreams: US, Canada (24%)

Prophetic dreams: US, Canada, Poland (32%)

Lucid dreams: Spain, Portugal (50%)

Recurring dreams: Sweden, the Netherlands (53%)

Keeping the dream alive.

While everyone has dreams, not every dream gets remembered. About every fourth person occasionally writes down their dreams, but only a few keep a regular dream diary.

The eagerness to recall dreams seems to be a generational preference, as Gen Z’ers (45%) and Millennials (37%) are far more likely to write down their dreams as compared to Gen X’ers (17%) and Baby Boomers (7%).

Most people (60%) say they have researched what their dreams mean, and 1 in 4 Gen Z’ers (24%) do it often.

Would you like cheese on that?

More than a third of people (37%) say they’d actively choose to eat or drink something that would help them remember their dreams better. That’s especially great news for dairy manufacturers, as research shows cheese may help with dream recall. Thanks to their cheese consumption, Canadians (37%) are the most likely to have already remembered a dream. Italians are very willing to try this (53%), making them more than twice as willing as the Danish (25%) to do so and significantly outpacing their American (24%) and European (19%) counterparts.

Dreams of adventure.

As for the most common types of dreams, people often experience exploring nature and seeing distant places, more so than imagining themselves as an athlete, musician, or artist. If you’re experiencing an even more far-out dream, you’re in good company, 1 in 5 people has dreamed about going to outer space.

Distant new places.

  • Women dream more often about exploring nature and seeing distant places on Earth. In contrast, men more often dream about going to outer space. However, the differences are more significant across generations than between genders.

  • 30% of Gen Z’ers have dreamt about being social media influencers. That’s least prevalent in Austria (21%) and most common in New Zealand (40%).

Dreamed I was someone new.

Reflecting their values and interests, Gen Z’ers and Millennials are more likely to dream about quitting their jobs to pursue passions or turn hobbies into careers, or dream about innovating something impactful or innovative for the greater good.

Meanwhile, for people over the age of 40 there seems to be a drastic decrease in dreams overall.

The only consistent dream among all generations is around travel or going on vacation.

Balancing good and villainy.

Dreams where a person becomes a superhero, are more common than dreaming about being the villain in all countries, but there are wide variations in how frequent it is across borders. Spanish people are ten times more likely to dream about being a superhero than a villain, whereas in Finland and Poland, they dream about being a villain almost as often as being the hero.

In a similar comparison, it seems that there is a clear divide between countries when it comes to whether it’s more common to dream about becoming a real person or a fictional character.

The ideal dream purchase.

Having explored what people dream about while asleep, in this section, we explore what shoppers across the world consider to be a “dream purchase.” For many shoppers, there is one (or many!) items out there they have been pining over or admiring from a distance. Some items are more obtainable, others are more aspirational. Either way, we checked in with shoppers on how long they’d wait to make a purchase, how much they’re willing to spend, and more.

What triggers a dream purchase?

In some countries, as many as two-thirds of people have an ideal dream purchase they are looking to purchase. And about half say there is a specific event that would trigger a dream purchase. What that occasion is, varies across countries and generations, but the most common reason seems to be moving to a new residence.

Baby Boomers (20%) are four times more likely to consider retirement a motivator for a dream purchase compared to younger age groups (5%) for whom retirement feels much farther away. On the contrary, at the starting point of working life, Gen Z’ers (20%) are ten times more likely to consider graduation a motivating factor compared to Baby Boomers (2%).

Dreaming for someone else.

Shoppers aren’t only thinking of themselves, approximately half also have a “dream purchase” for someone else. Most often, that someone is a family member or significant other—this is consistent across age groups. However, the younger you are, the more likely you are to be planning to surprise a friend over a family member with their ideal dream purchase.

Defining a dream purchase.

The idea behind dream purchases is something that solves a particular need or opens up new life opportunities, and is consistent across generations. However, younger generations are more likely to consider dream purchases as something to support their hobbies, or that has emotional value.

Open up new life opportunities or solve a particular need?

  • Americans and Australians are more likely to consider a dream purchase to open up new life opportunities. At the same time, Canadians and Europeans are more likely to want something to solve a particular need.

The price is right? Or the time?

More than one-third (37%) insist it’s impossible to put a price tag on what should be considered an ideal dream purchase, and most shoppers (55%) say there is no specific timeframe one has to wait for an item to become a dream purchase.

And the older (and more experienced?) a person is, the more likely they are to believe a dream purchase doesn’t have to come with a specific price tag or that they have to wait to make their dreams come true. However, among those who would put a price tag on a purchase, only 15% say it has to cost more than $5,000.

And for those saying one needs to wait a specific time before an item becomes a dream purchase, it appears people are eager to make their dreams come true, considering purchasing the item in roughly 95 days, or three months, on a global average.

Reasons for a dream deferred.

The top hindrance preventing a dream purchase is cost (62%). Overall, the average time people are willing to wait for a discount for their dream purchase is 134 days, or about 4-5 months. At the same time, 26% of people are willing to wait however long they have to, while 13% say they won’t wait for a discount at all.

Gender, more than age, seems to have a bigger impact when it comes to being patient for a good deal. Women (29%) are more willing to wait as long as it takes compared to men (22%), while Baby Boomers are both twice as likely to wait as long as it takes (36%) and not wait at all (19%) compared to Gen Z’ers (16% and 7%).

The objects of dreams.

One common experience we’ve seen across demographics and borders is people dreaming about something they do not yet own or possess—call it the “Rosebud effect,” in honor of Citizen Kane. Moving from the ethereal to the (potentially) more tangible, for many people, there are also items they don’t yet possess but are considered “dream purchase.”

Dreams about missing items.

It’s widespread to dream about participating in an activity requiring an object you don’t have (imagine skiing without the skis). Another common theme involves owning an item you don’t actually possess when you wake up (like a magic wand that turns random objects into pastries). About half (43%) of people can recall dreams with these ideas. In these dreams, people are most commonly participating in sports or exercise without the proper equipment, or owning unique fashion items. One noted difference, men regularly imagine owning high-end electronics only to wake up and realize it was just a dream.

Lemme upgrade ya.

Half (49%) of shoppers worldwide are currently looking to level up or improve something important to them. Among the genders, men are more likely to be waiting to make purchases for Electronics, Entertainment, and Leisure, and Sports & Hobby, while women favor Clothing & Shoes, Jewelry & Accessories, Beauty, and Home & Garden to a greater extent.

The most popular products to dream about are electronics, but comparing all age groups to each other, the priorities more clearly shifts:

  • Gen Z: Beauty, and Jewelry & Accessories.
  • Millennials: Children’s Products, and Beauty.
  • Gen X: Leisure, Sports & Hobby, and Home & Garden.
  • Baby Boomers: Baby Boomers: Home & Garden, and Leisure, Sports & Hobby.

Kicking up the look.

Among those looking for fashion items, shoes are the top item to level up or replace for both women (49%) and men (50%). Apart from footwear, men want new jeans and jackets, while women prefer dresses and jewelry.

Top of the fashion carts.

  • US shoppers are looking for accessories like hats, gloves, and belts (31%) and jewelry (49%) to a greater extent than in any other country, while in Spain (40%) of people are most eager to level up their swimwear.

  • The greatest differential in priority comes around the desire to buy a new bag with New Zealand (37%) and Germany (7%) in stark contrast.

Leveling up their favorite things.

Hobbies are one of the areas where people are actively looking to upgrade or replace their current items. Overall, about 24% of people on average are looking to do so, with some activities (like making music or learning a new instrument) seeming to attract more dream purchases than others.

Gamers want to level up.

  • More than one-third of people playing computer/video games (35%), and those who make music or are currently learning a new instrument (34%), would like to improve an item they use for that activity.

  • The activities people feel less inclined to level up or replace an item are dancing, yoga, and pilates.

Dreams and DIY activities.

More than one-fourth (26%) say DIY activities like painting, sculpturing, knitting, and crocheting are among the things they like to do the most.

The most popular DIY activity for all generations is painting, except for Baby Boomers who prefer knitting. However, comparing the preferences of all age groups to each other, the preferred activities become more diverse—and so do the things they would like to try the most.

The DIY activities that each generation currently do, and would like to try, the most compared to other generations.

Age groupCurrent favoriteWould like to try the most
Gen ZSculpturingKnitting
MillennialsCalligraphyKnitting
Gen XCandle & Soap makingJewellery
Baby BoomersKnittingPainting

And that’s that.

Thirsty for more knowledge?

Make sure to check out the other reports available at Klarna Insights.

Loyalty cards.

Plastic loyalty cards. Most of us have a whole bunch of them stacked in our wallets or lying around at home and have most definitely been offered to sign up to many more. They promise us discounts, cashback and rewards for being loyal customers when shopping in-store. But there are only so many loyalty cards you can fit into one wallet. How can brands convince consumers to sign up to yet another loyalty program? How is shoppers’ behaviour with respect to loyalty cards changing in the face of the rising popularity of mobile payments?

In this report, we deep dive into the attitudes towards loyalty cards across 19 markets, with responses from 20,000 consumers across the world.

Happy exploring!

Methodology.

Klarna research occurred in May 2022, in cooperation with Dynata and across 19 countries (US, Canada, UK, Ireland, Australia, New Zealand, Germany, Austria, Poland, Netherlands, Belgium, France, Sweden, Norway, Finland, Denmark, Italy, Spain, and Portugal). The survey includes a minimum of 1,000 respondents in each country. In total, 20,413 consumers ages 18 to 75 participated.

19 countries

20,413 consumers

Are there more loyalty cards or wallets in the world?

The retail version of the “doors or wheels” brain teaser could be “loyalty cards or wallets”. If you check the homes and pockets of shoppers across the world, will you find more loyalty cards or wallets?

The majority has more than one.

Many retailers offer incentives and benefits to retain loyal customers and it’s clear they are very popular. While very few shoppers are not tempted by discounts and rewards from their favorite retailers, the vast majority has more than one.

84%

have at least one loyalty card.

68%

have more than one.

Most loyalty card holders use it at least one once a week.

Whether you’re shopping for groceries and everyday essentials, making a dream purchase or have found yourself at the checkout with an impulse buy, reward programs appear to work well as an incentive for using loyalty cards. After all, every penny spent counts towards a return. 2 out of 3 are using a loyalty card on a weekly basis, while 9 out of 10 are using them once a month. An estimate based on the frequency of usage shows that the average shopper uses a loyalty card around 108 times each year.

Overwhelming amounts of physical cards.

Today, despite a massive shift towards digital payments, you are still very likely to find a plastic loyalty card in most shoppers’ wallets. But you are equally as likely to find a shopper who has left one or more of their cards at home, or rejected the idea of signing up to another loyalty program altogether, unwilling to carry another card with them while out shopping.

The wide availability of loyalty programs is overwhelming for shoppers.

Ever been out shopping and been asked to join another reward program? You are not alone. We’ve all been there, stood at the checkout weighing up whether it’s worth signing up to another loyalty program. Is the opportunity to save money great enough? Is it worth having to carry another card with me? With the majority of retailers offering a loyalty program these days, consumers are feeling overwhelmed. This sentiment is felt most strongly by younger generations, while the Baby Boomers are the most open to joining new and a broader number of programs.

Many loyalty cards are left behind by shoppers.

Despite the benefits of discounts, rewards and cash back loyalty programs, the majority of shoppers are not bringing all their loyalty cards with them when they go shopping – which means that they risk losing out on the benefits if caught without their card at the checkout.

52%

52% of shoppers don’t carry all their loyalty cards with them.

Gen Z

are the most likely to leave their physical cards at home, and less than a third (31%) have all their loyalty cards available when they go shopping.

The vast majority of shoppers have rejected a new loyalty card.

There are no downsides to signing up for a loyalty card
 or are there? Despite loyalty cards being offered to shoppers for free, with the intention to save users money, consumers still reject signing up to new loyalty programs. Why? For the majority, it comes down to how attractive the reward program is, although nearly one-third have also avoided a loyalty program simply because they didn’t want to add another card to their wallet. What’s clear is for retailers to onboard new loyalty members, the kickback needs to outweigh the hassle of signing-up and committing to another card.

74%

of shoppers have rejected a loyalty card. Gen Z’ers (81%) are the most likely to have done so, while Baby Boomers (55%) are the least.

33%

say it is because they don’t want another card to carry with them – or any plastic cards at all.

Missing out on the benefits.

Have you ever reached the checkout to discover you left your loyalty card at home so can’t collect the reward points? Or that you previously declined one in the same checkout because you didn’t want to carry another plastic card? You are not alone with this either, and you are once again more likely a member of the younger generations.

Is the future of loyalty cards digital?

The shift towards digital has never been faster. Today shoppers are in search of more efficient solutions that help them save time and money when shopping. With smart ways to pay on your phone, loyalty cards will follow a similar transition.

Shoppers are positive towards replacing their plastic cards with a mobile app.

Unsurprisingly, given that shoppers express feeling overwhelmed by the amount of loyalty programs available and as a result, the number of plastic cards they need to carry with them, an overwhelming majority are positive towards carrying them digitally.

73% of shoppers globally are positive about replacing their plastic cards with an app that stores all of their loyalty and rewards programs digitally. While this trend is reflective across demographics, the sentiment is the strongest among the younger generations, with 81% of Gen Z’ers and 82% of Millennials look forward to a future in which they never miss out on potential benefits in the checkout when shopping at their favorite stores – assuming they wouldn’t leave their smartphones at home.

And that’s that.

Thirsty for more knowledge?

Make sure to check out the other reports available at Klarna Insights.